Table of Contents
I. Introduction to Break Even Analysis Reports
II. Understanding Break Even Analysis Reports
III. Components of Break Even Analysis Reports
IV. Types of Break Even Analysis Reports
V. Importance of Break Even Analysis Reports
VI. FAQs (Frequently Asked Questions)
I. Introduction to Break Even Analysis Reports

- Importance of Break Even Analysis Reports
The importance of Break Even Analysis Reports cannot be overstated in business planning and decision-making. These reports provide crucial insights into the financial health and viability of a business. By identifying the break-even point, businesses can understand the minimum sales volume needed to cover all costs and avoid losses. This information is essential for setting pricing strategies, determining production levels, and assessing the impact of changes in costs or revenue.
Break Even Analysis Reports also help businesses to evaluate different scenarios and make informed decisions about investments and expansions. Ultimately, these reports enable businesses to manage risks effectively, optimize profitability, and achieve long-term financial sustainability. They serve as a valuable tool for managers, executives, and stakeholders to understand and strategize for the future growth of the business.
II. Understanding Break Even Analysis Reports
- Definition of Break Even Analysis
Break Even Analysis, in the context of understanding Break Even Analysis Reports, is a financial technique used by businesses to determine the point at which total revenue equals total costs, resulting in neither profit nor loss. This analysis identifies the break-even point, which is crucial for decision-making in areas such as pricing, production, and financial planning. By calculating the break-even point, businesses can assess the minimum level of sales needed to cover both fixed costs (such as rent and salaries) and variable costs (such as materials and utilities).
Break Even Analysis provides valuable insights into the financial health of a business, helping managers and stakeholders make informed decisions to maximize profitability and minimize risk. It serves as a foundational tool in financial analysis and strategic planning, essential for achieving long-term business sustainability and growth.
- Formula for Break Even Point Calculation
Fixed Costs are an essential component in the formula for calculating the Break Even Point, a critical aspect of Understanding Break Even Analysis Reports. Fixed Costs refer to expenses that do not vary with the level of production or sales, including items like rent, salaries, and insurance premiums. In Break Even Analysis, these costs remain constant regardless of changes in sales volume.
Understanding and accurately accounting for fixed costs are crucial as they directly impact the Break Even Point calculation. By identifying and summing these costs, businesses can determine the minimum level of sales needed to cover all fixed expenses and reach the Break Even Point, where total revenue equals total costs. This calculation is fundamental in guiding pricing decisions, production strategies, and overall business planning, ensuring profitability and sustainability in the long term.
Variable Costs play a pivotal role in the formula for calculating the Break Even Point, an essential aspect of Understanding Break Even Analysis Reports. Variable Costs are expenses that fluctuate in direct proportion to changes in production or sales levels, such as raw materials, labor, and utilities. In Break Even Analysis, these costs are directly tied to the volume of goods or services produced and sold. Properly identifying and measuring variable costs are critical for accurate Break Even Point calculations.
By understanding the relationship between variable costs and sales volume, businesses can determine the minimum level of sales required to cover all variable costs and achieve the Break Even Point, where total revenue equals total costs. This analysis aids businesses in making informed decisions about pricing, production levels, and cost management strategies to ensure profitability and operational efficiency.
The Selling Price is a key component in the formula for calculating the Break Even Point, an essential aspect of Understanding Break Even Analysis Reports. The Selling Price refers to the amount at which goods or services are offered to customers. In Break Even Analysis, the selling price per unit directly impacts the Break Even Point calculation. By dividing the total fixed costs and variable costs per unit by the selling price per unit, businesses can determine the minimum number of units they need to sell to cover all costs and achieve the Break Even Point, where total revenue equals total costs.
Accurately setting the selling price is crucial for profitability and business sustainability, as it affects revenue generation and overall financial performance. Understanding the relationship between selling price, costs, and sales volume enables businesses to make informed decisions about pricing strategies and optimize their operations for long-term success.
- Graphical Representation of Break Even Analysis
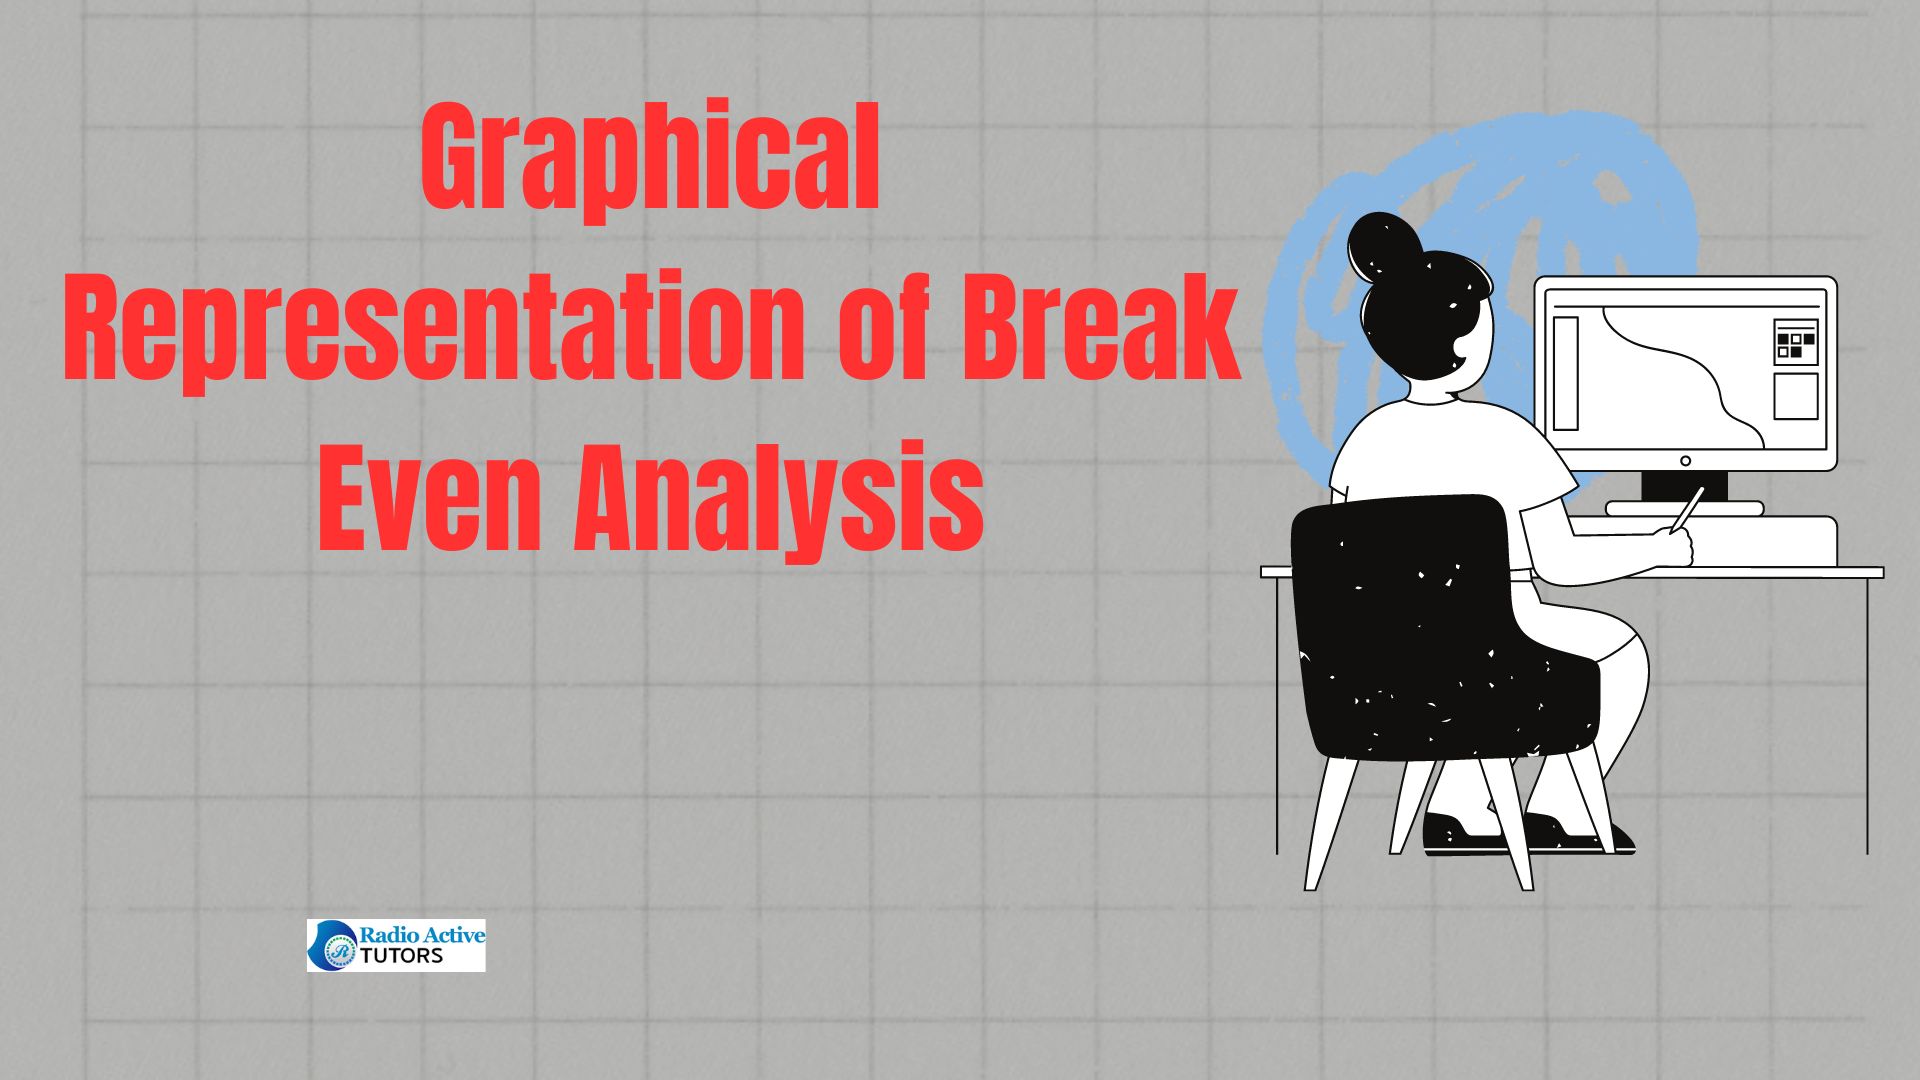
Graphical representation of Break Even Analysis is a fundamental tool in Understanding Break Even Analysis Reports. It visually illustrates the relationship between revenue, costs, and profits at various levels of sales volume. The Break Even Point, where total revenue equals total costs, is depicted as the intersection of the revenue line and the total cost line on the graph. Typically, the graph shows a fixed cost line that remains constant and a variable cost line that increases with production levels. The revenue line slopes upward with increasing sales volume based on the selling price per unit.
By plotting these lines on a graph, businesses can easily identify the Break Even Point and visually assess the impact of different sales scenarios on profitability. This graphical representation aids in decision-making processes, such as setting sales targets, determining pricing strategies, and evaluating the feasibility of new business ventures. It provides a clear, intuitive way to understand financial data and make informed strategic decisions to optimize business performance.
III. Components of Break Even Analysis Reports
- Introduction to Break Even Analysis Reports
Introduction to Break Even Analysis Reports serves as a comprehensive overview of the financial tool used by businesses to determine the point at which total revenue equals total costs. These reports provide critical insights into the financial health and operational efficiency of a business. The components of a Break Even Analysis Report typically include the Break Even Point, which identifies the minimum sales volume required to cover all costs; Fixed Costs, which are expenses that remain constant regardless of sales volume; Variable Costs, which fluctuate based on production levels; and the Selling Price per unit. These components are essential for decision-making in pricing, production planning, and financial management.
Break Even Analysis Reports enable businesses to assess profitability, manage costs effectively, and make informed decisions to achieve long-term financial sustainability and growth. They are invaluable tools for managers, executives, and stakeholders seeking to optimize business performance and maximize profitability.
- Detailed Explanation of Components
Sales Revenue is a crucial component in the detailed explanation of components within a Break Even Analysis Report. It represents the total income generated from selling goods or services at a given selling price. In Break Even Analysis, sales revenue is calculated by multiplying the number of units sold by the selling price per unit. It plays a central role in determining the Break Even Point, which is the level of sales at which total revenue equals total costs. Understanding sales revenue helps businesses to evaluate the impact of different pricing strategies and sales volumes on profitability.
By analyzing sales revenue alongside fixed costs, variable costs, and the selling price, businesses can make informed decisions about production levels, pricing strategies, and overall business operations. This analysis is essential for optimizing revenue generation and ensuring financial stability and growth over time.
Fixed Costs are a critical component in the detailed explanation of components within a Break Even Analysis Report. These costs represent the expenses that remain constant regardless of the level of production or sales volume. Examples include rent, salaries, insurance premiums, and depreciation. In Break Even Analysis, understanding fixed costs is essential because they directly impact the Break Even Point calculation. By identifying and accurately quantifying fixed costs, businesses can determine the minimum level of sales needed to cover these expenses and break even—where total revenue equals total costs.
Fixed costs are an important consideration in pricing decisions, as they establish a baseline that must be covered before a business can begin to make a profit. Managing fixed costs effectively allows businesses to improve financial stability and make informed decisions about cost control measures and investment opportunities. Thus, a detailed understanding and analysis of fixed costs are crucial for optimizing business operations and achieving long-term profitability.

Variable Costs are a vital component in the detailed explanation of components within a Break Even Analysis Report. These costs fluctuate in direct proportion to changes in production or sales volume. Examples include raw materials, direct labor, and utilities. In Break Even Analysis, variable costs are crucial because they influence the Break Even Point calculation. The total variable costs increase as production or sales volume increases. Understanding variable costs is essential for businesses to determine the minimum level of sales required to cover all variable expenses and reach the Break Even Point, where total revenue equals total costs.
By analyzing variable costs alongside fixed costs, businesses can make informed decisions about pricing strategies, production levels, and cost management. Effective management of variable costs allows businesses to improve profitability, optimize resource allocation, and respond quickly to changes in market conditions. Therefore, a detailed understanding and analysis of variable costs are fundamental for strategic decision-making and achieving financial sustainability.
The Break Even Point is a pivotal component in the detailed explanation of components within a Break Even Analysis Report. It represents the level of sales at which total revenue equals total costs, resulting in neither profit nor loss. In Break Even Analysis, this point is calculated by dividing total fixed costs by the contribution margin per unit, where the contribution margin is the selling price per unit minus the variable cost per unit. The Break Even Point serves as a critical milestone for businesses as it indicates the minimum level of sales needed to cover all costs.
It provides insights into the financial health of a business and helps in making informed decisions about pricing, production levels, and overall business strategy. By achieving the Break Even Point, businesses can start generating profit beyond covering their costs. Analyzing the Break Even Point alongside other components such as fixed costs, variable costs, and sales revenue enables businesses to optimize profitability, manage costs effectively, and ensure long-term financial sustainability and growth.
Contribution Margin is a key component in the detailed explanation of components within a Break Even Analysis Report. It represents the amount of revenue remaining after covering variable costs, and it is crucial for understanding profitability at different levels of sales. In Break Even Analysis, the contribution margin per unit is calculated as the difference between the selling price per unit and the variable cost per unit. Alternatively, it can be calculated as the contribution margin ratio, which is the contribution margin per unit divided by the selling price per unit.
Contribution Margin helps businesses assess the financial impact of sales on profitability, as it indicates how much revenue contributes towards covering fixed costs and generating profit. By analyzing contribution margin alongside fixed costs, variable costs, and the Break Even Point, businesses can make informed decisions about pricing strategies, product mix, and operational efficiency. Maximizing contribution margin is essential for improving overall profitability and ensuring sustainable business growth over time.
Margin of Safety is a critical component in the detailed explanation of components within a Break Even Analysis Report. It represents the amount by which sales can drop before a business reaches its Break Even Point. In other words, it is the difference between actual or projected sales and the Break Even Point sales. The Margin of Safety provides businesses with a cushion against unexpected downturns in sales or changes in the market environment.
A higher Margin of Safety indicates that a business is in a better position to cover its fixed costs and generate profit even if sales decrease. It is calculated as the difference between actual or projected sales and the Break Even Point sales, divided by actual or projected sales. Understanding and monitoring the Margin of Safety allows businesses to assess their risk exposure, make informed decisions about pricing, production levels, and cost management, and improve overall financial stability. A healthy Margin of Safety is indicative of a resilient business that can weather fluctuations in the market and maintain profitability over the long term.
IV. Types of Break Even Analysis Reports
- Types Based on Time Frame
- Short-term Break Even Analysis
Short-term Break Even Analysis is a type of analysis based on a short time frame within the context of Types of Break Even Analysis Reports. It focuses on determining the Break Even Point over a relatively brief period, usually within a year or less. This analysis is particularly useful for assessing the immediate financial viability of a project, product, or service. It takes into account short-term fluctuations in costs, sales volume, and market conditions to determine the minimum level of sales required to cover all costs within a specified period.
Short-term Break Even Analysis reports help businesses make tactical decisions regarding pricing, promotions, and resource allocation in the short term. By understanding the Break Even Point in the short term, businesses can effectively manage cash flow, optimize production levels, and make adjustments to operations to maximize profitability and minimize risk in the immediate future.
- Long-term Break Even Analysis
Long-term Break Even Analysis is a type of analysis based on an extended time frame within the context of Types of Break Even Analysis Reports. It focuses on assessing the Break Even Point and profitability over a longer period, typically more than a year. This analysis takes into consideration long-term trends in costs, sales volume, and market conditions to determine the minimum level of sales required to cover all costs and achieve profitability over the long haul. Long-term Break Even Analysis reports are crucial for strategic planning and decision-making, especially in evaluating the financial feasibility of long-term projects, investments, and business expansions.
By understanding the Break Even Point over the long term, businesses can make informed decisions about capital investments, pricing strategies, and overall business strategy to ensure sustainable growth and profitability. This type of analysis helps businesses to plan for the future, manage risks effectively, and optimize their operations to achieve financial stability and success in the long run.
Single Product Analysis is a type of analysis based on scope within the context of Types of Break Even Analysis Reports. It focuses on evaluating the Break Even Point and profitability of a single product or service offered by a business. This analysis is essential for businesses that produce or sell a limited range of products or services. Single Product Analysis allows businesses to determine the minimum level of sales required to cover all costs associated specifically with that product or service.
By analyzing the Break Even Point for a single product, businesses can make strategic decisions about pricing, production levels, and marketing strategies tailored to maximize profitability for that specific product. This type of analysis provides a clear and focused assessment of the financial performance of individual products, helping businesses to allocate resources efficiently and optimize their product portfolio for greater profitability and growth.
Multi-Product Analysis is a type of analysis based on scope within the context of Types of Break Even Analysis Reports. It focuses on evaluating the Break Even Point and profitability across multiple products or services offered by a business. This analysis is particularly relevant for businesses that offer a diverse range of products or services with varying costs, pricing, and sales volumes. Multi-Product Analysis allows businesses to assess the overall financial performance of their entire product portfolio and make strategic decisions to optimize profitability.
By analyzing the Break Even Point for each product or service, businesses can identify which products are contributing the most to profitability and which may require adjustments in pricing, production, or marketing strategies. This type of analysis provides businesses with a comprehensive view of their product mix, enabling them to allocate resources effectively, manage costs, and maximize overall profitability across their entire product portfolio. It helps businesses to make informed decisions about resource allocation, product development, and strategic planning to achieve long-term financial sustainability and growth.
V. Importance of Break Even Analysis Reports

Break Even Analysis Reports serve as a crucial decision-making tool for businesses, providing valuable insights into financial viability and profitability. These reports are important because they enable businesses to determine the minimum level of sales required to cover all costs and achieve the Break Even Point, where total revenue equals total costs. By understanding the Break Even Point, businesses can assess the impact of different scenarios on profitability, such as changes in pricing, costs, or sales volume. This analysis helps businesses to make informed decisions about pricing strategies, production levels, and cost management to optimize profitability.
Break Even Analysis Reports also aid in evaluating the financial feasibility of new projects, investments, or expansions by providing a clear picture of the expected financial outcomes. Overall, Break Even Analysis Reports are essential for strategic planning, risk management, and ensuring long-term financial sustainability and growth in business operations. They empower managers, executives, and stakeholders to make sound decisions that support profitability and drive business success.
Financial planning is significantly enhanced by Break Even Analysis Reports, underscoring their importance in business operations. These reports provide essential insights into the financial health and stability of a business by identifying the Break Even Point—the level of sales at which total revenue equals total costs. This information is crucial for developing effective financial strategies, such as setting realistic sales targets, determining pricing strategies, and managing costs. Break Even Analysis Reports enable businesses to forecast and manage cash flow effectively, ensuring that there is sufficient revenue to cover all expenses.
Moreover, these reports help in assessing the financial feasibility of new investments, projects, or expansions by evaluating their potential to reach profitability. By incorporating Break Even Analysis into financial planning, businesses can make informed decisions that support sustainable growth, optimize resource allocation, and mitigate financial risks. Overall, Break Even Analysis Reports are indispensable tools for financial planning, enabling businesses to achieve long-term financial stability and success.
VI. FAQs (Frequently Asked Questions)
- What is the purpose of break even analysis reports?
- How do you calculate the break even point?
- What are the limitations of break even analysis?
- When should Break Even Analysis Reports be used?
- How often should Break Even Analysis Reports be updated?


